top of page

Search


Final Story Map and Presentation
Story map for finding crab in Prince William Sound Alaska
kinsjusta
1 min read
Enhanced Clustering
Clustering helps visualize patterns when a large amount of data points are present. New features in Esri now allow for labeling of...
kinsjusta
1 min read


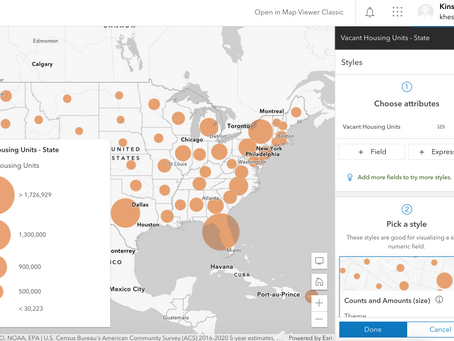
Symbolize by Size
Showing quantitative data through symbology. Symbolizing by size is best used when displaying a count or amount at a certain location....
kinsjusta
1 min read


Interpolation
Using data points to hypothesize and predict patterns across a space. For this exercise we look at a map of Oxaca Mexico. Metadata...
kinsjusta
2 min read


Determine Flood Risk
Determining flood risk for disaster response in Houston TX, with GIS. First we set a boundary for the city in question by adding a layer...
kinsjusta
3 min read


Walk Time Map
I created a walk time map to show the proximity of services and businesses to my town's boat harbor. The City of Cordova is currently...
kinsjusta
1 min read


Managing Data
Creating a hosted feature layer and establishing different audience views. This is useful in many scenarios for example if your audience...
kinsjusta
3 min read


kinsjusta
0 min read


Field Maps
Arc GIS Field Maps is useful tool for on-site field work that uses both maps and smart forms to create a more holistic data set. I live...
kinsjusta
4 min read


Initial Survey 123 Results
I was able to get 14 responses to my initial survey this week. I wanted to know about people's experience with coastal erosion at their...
kinsjusta
2 min read


Getting Started with Survey 123
Many fields, and especially the social sciences, use surveys to gather important data. Survey 123 with Arc GIS allows this data to have a...
kinsjusta
2 min read


Quick Capture: Urban Emotions
Using the Arc GIS Quick Capture tool I made a map representing the Psycho-geography of Kailua Hawaii where I live. To build this map I...
kinsjusta
2 min read


kinsjusta
0 min read
Volcano Story Map
Working off of National Geographic's Volcano story map we can see that the team utilized a mix of text and imagery to keep the reader's...
kinsjusta
2 min read


Browsing Esri's Story Map Gallery
Looking through Esri's Story Map Gallery I chose to explore the map: "A Quest for Chinook Salmon in the Yukon" This map drew my interest...
kinsjusta
2 min read
Coordinate Systems & Map Projections
Coordinate systems Coordinate systems help us establish location and direction, in other words they are the frames of reference for us to...
kinsjusta
3 min read


The True Size of...
Using the website tool True Size of I learned about the distortions inherent in the web mercator projection. This projection stretches...
kinsjusta
2 min read


10 Maps in a Minute
Exploring the different uses and functionality of ArcGIS maps. GIS data is either projected as Raster or Vector. Raster data is presented...
kinsjusta
6 min read


Hello!
Hello, I'm Kinsey. I am currently a graduate student at the University of Hawai'i Manoa in the department of Anthropology. My research...
kinsjusta
1 min read
bottom of page