
Field Maps
- kinsjusta
- Mar 5, 2022
- 4 min read
Updated: Mar 6, 2022
Arc GIS Field Maps is useful tool for on-site field work that uses both maps and smart forms to create a more holistic data set. I live in Kailua, HI so I will be mapping kailua District park. This will be good practice and include a lot of walking because it is a very large public park! I worked through the tutorials here.
Creating a Map for Data Collection in Arc GIS
Each layer created in the Field maps app contains information that will be captured in the form. After creating a point layer and polygon layer to capture both places and areas, these layers are configured in the data tab.
In the data list for Places I added a variety of amenities that may be found in a park:
Bench, Restroom, Tree, Water fountain, Bike rack and trash can. A similar process is repeated for the Area/paths layer in which I added values such as playground, tennis court, dirt, parking etc.
Once in Map viewer classic the name and content icons of the layer can be edited. This was an easy step since it is very similar to the Quick Capture edits.

Configuring a Map for Data Collection
In order to configure a map for data collection in the field you'll first to author a form. After this is created and configured with the feature layer and map settings the map will be ready to be shared and used. In this example the form completed indicated whether painting needs to be addressed at certain park features. The follows fields were added to the park features layer data:

For the "needs paint" field a list was created which gave the option of wither yes or no with corresponding values of 0 and 1. I was happy to learn this feature mores specifically because I tried to create a yes/no field on a pervious Quick Capture assignment and couldn't quite figure it out. Next, in the Field Maps app you can open the map you'd created to begin configuring the form.

We're now working in the Field Maps app to edit the form. A blank form appears and you need to add all the fields to the place layer. The title needs to be edited to include you asset type data, this way it will populate on the map in a way that corresponds paint to the asset type.
Within the form you can edit the input type which is important for field that contain notes for example so that a person could write a multiline description. In the settings feature you can configure how feature's attributes and shapes will be copied when creating a new feature.
When the forms are configured to your liking, go to the share tab and decide permissions for who can access and edit the map. Finally, share via QR code or link so it can be used on mobile.
Collecting Actual Data in the Field
I walked through most of the public area in Kailua District park. I thought this would be an interesting place to map because there are a lot of amenities and further, because a school sits in the middle of the "park" not all the areas that are shown on Google maps are actually accessible to the public due to fences etc. I wanted to see how some of the areas aligned.
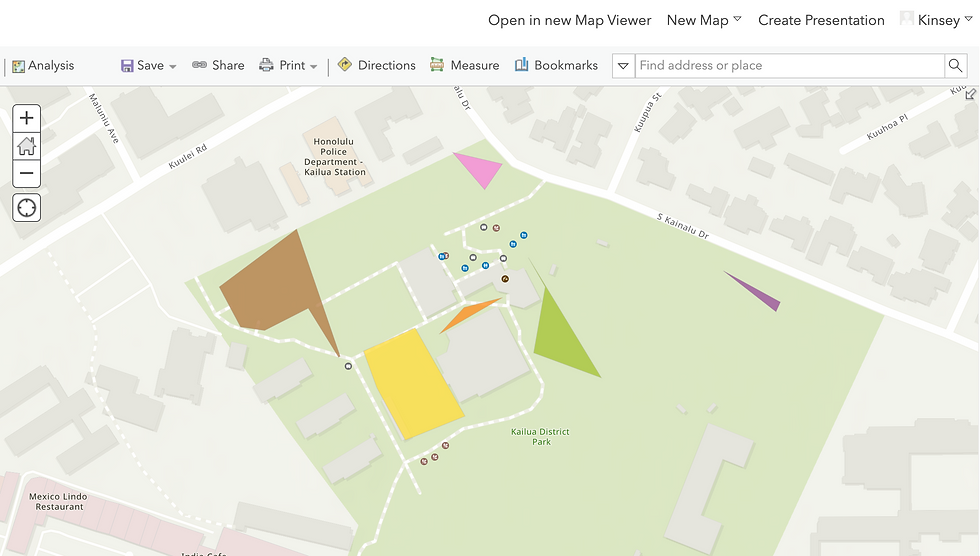
It was interesting to see how the polygons were created when I finished walking the perimeter. I noticed that, understandably, the areas that I placed more points at were better defined in terms of actual representative shape such as the pool shown here in yellow.
I used the asset type note feature that I configured earlier to record information about several benches in the park. Most were in great condition but this one here needed some attention due to graffiti.

The photo attachment tool opens a new window when in Map Viewer classic that allows you to see and download the photo taken in the field.

As you can see the damage isn't all that bad and I took a photo so that if someone were working maintenance they could know what to expect and prepare for. One drawback is that expected paint time was listed in hours and I don't think this needs that long so in the future I would put units of expected work time in minutes.
Overall I really liked this feature and the on-the-go style this allows for. I learned how to use the yes/no feature in the forms on a way that reflects in the map which is important for surveys and giving more information. I like the ability to easily represent both larger areas and small features at one and the accessibility was pretty user friendly.
One of the drawbacks I would note is that the app won't allow you to drop polygon points and features at the same time--you have to finish a three point polygon before adding a different feature which in a large park like this made me have to go over the same area twice. Another double back needed to happen when I mapped the grass and parking areas which bordered each other. Because I'm just one person I had to do this twice which shows why this app is maybe best used with a team especially if you are trying to map multiple features simultaneously and make the most of your time.

Comments